โœจ AI-powered chart generation for Slack

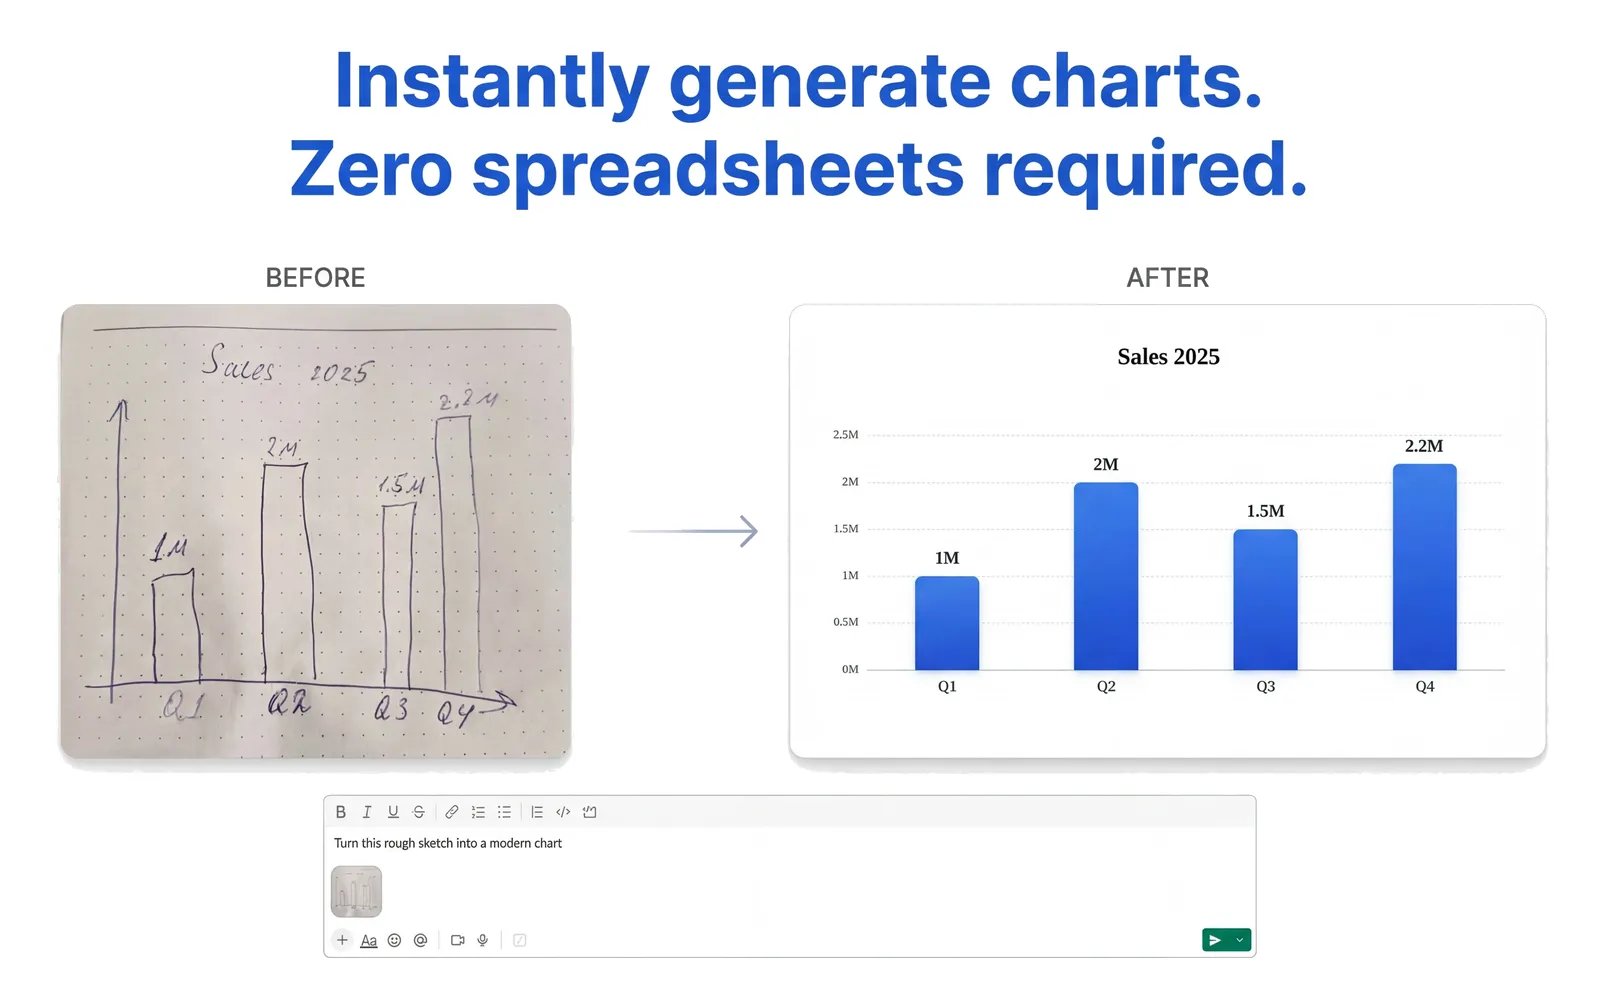
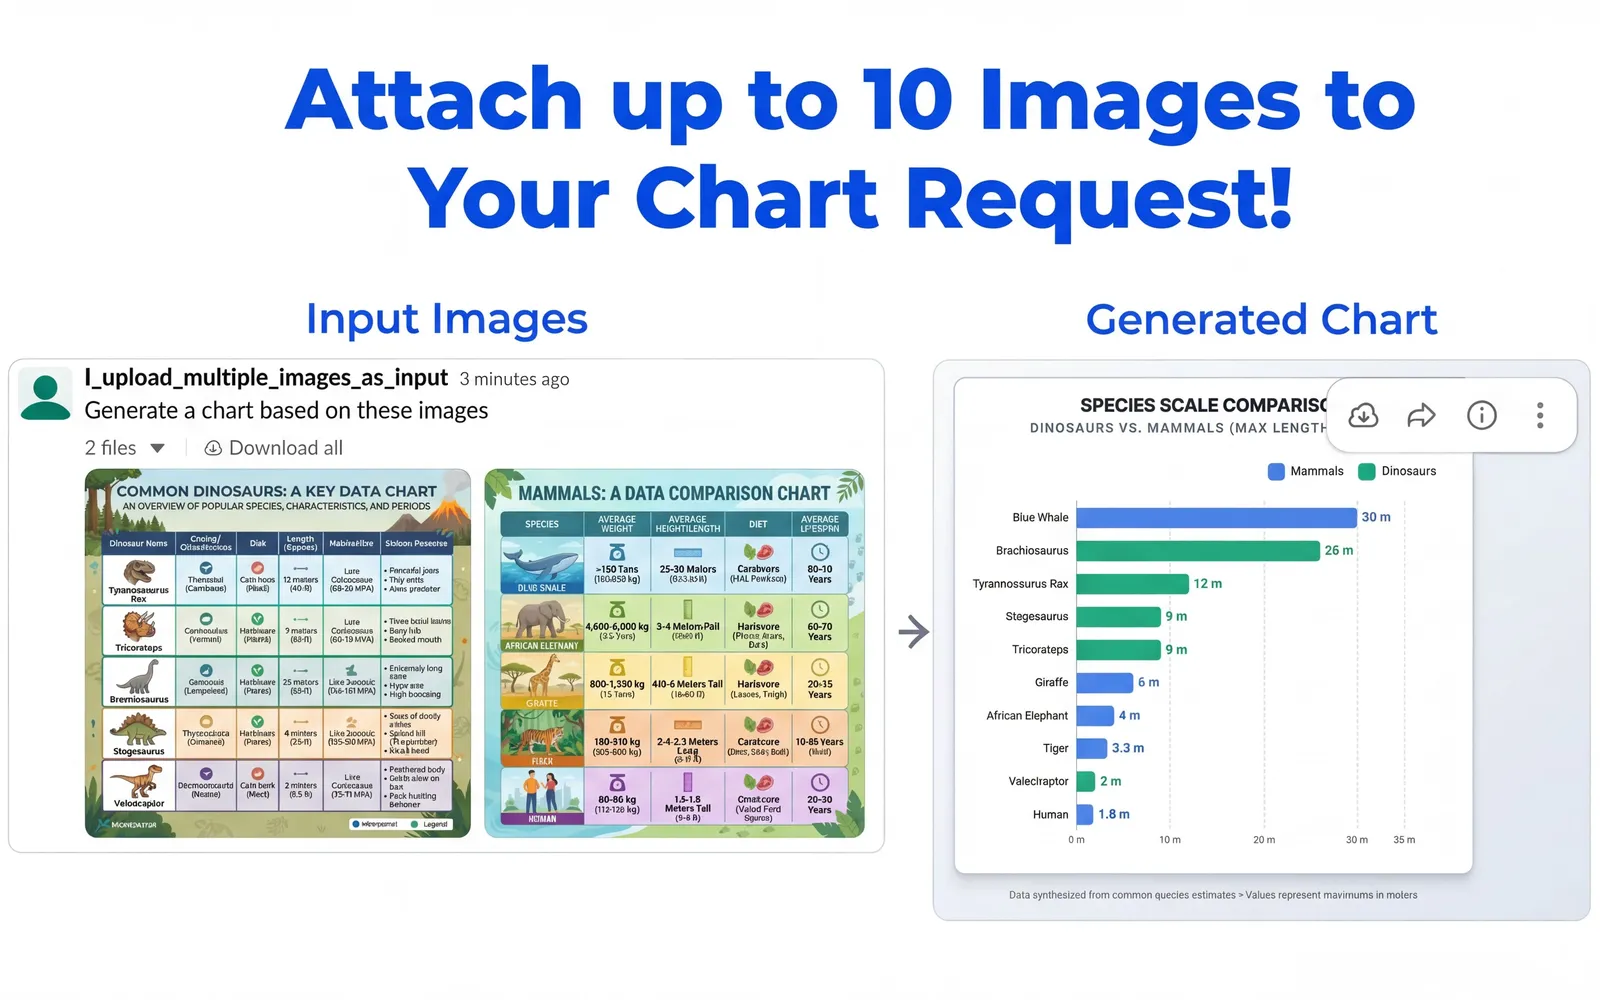
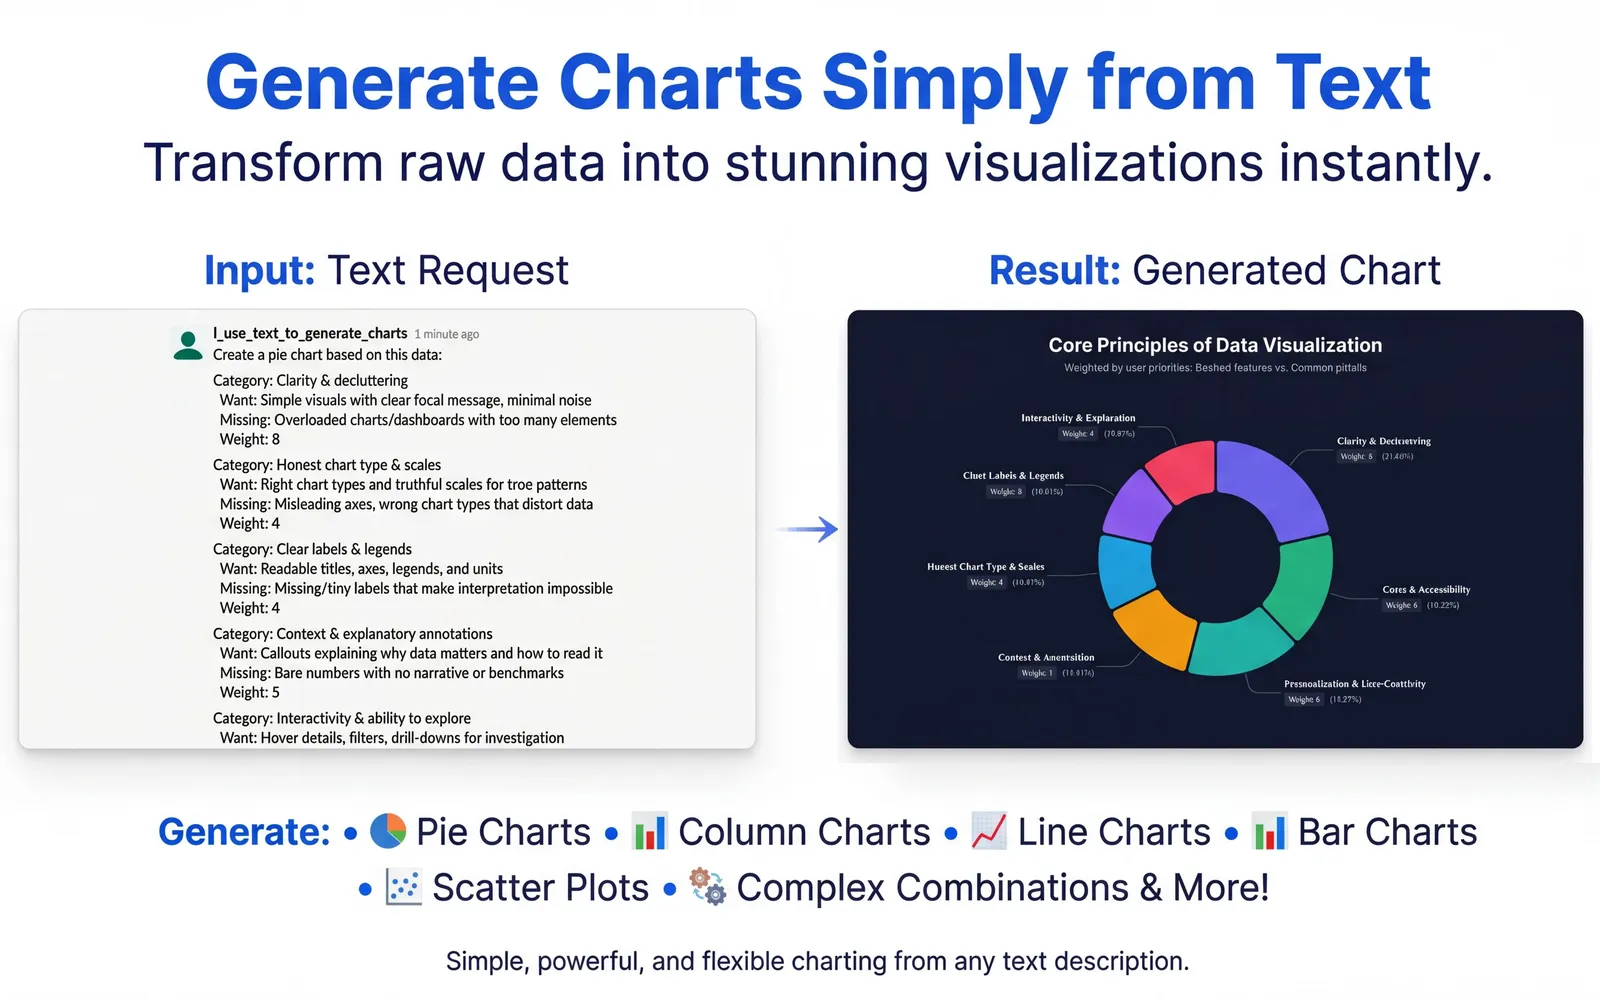
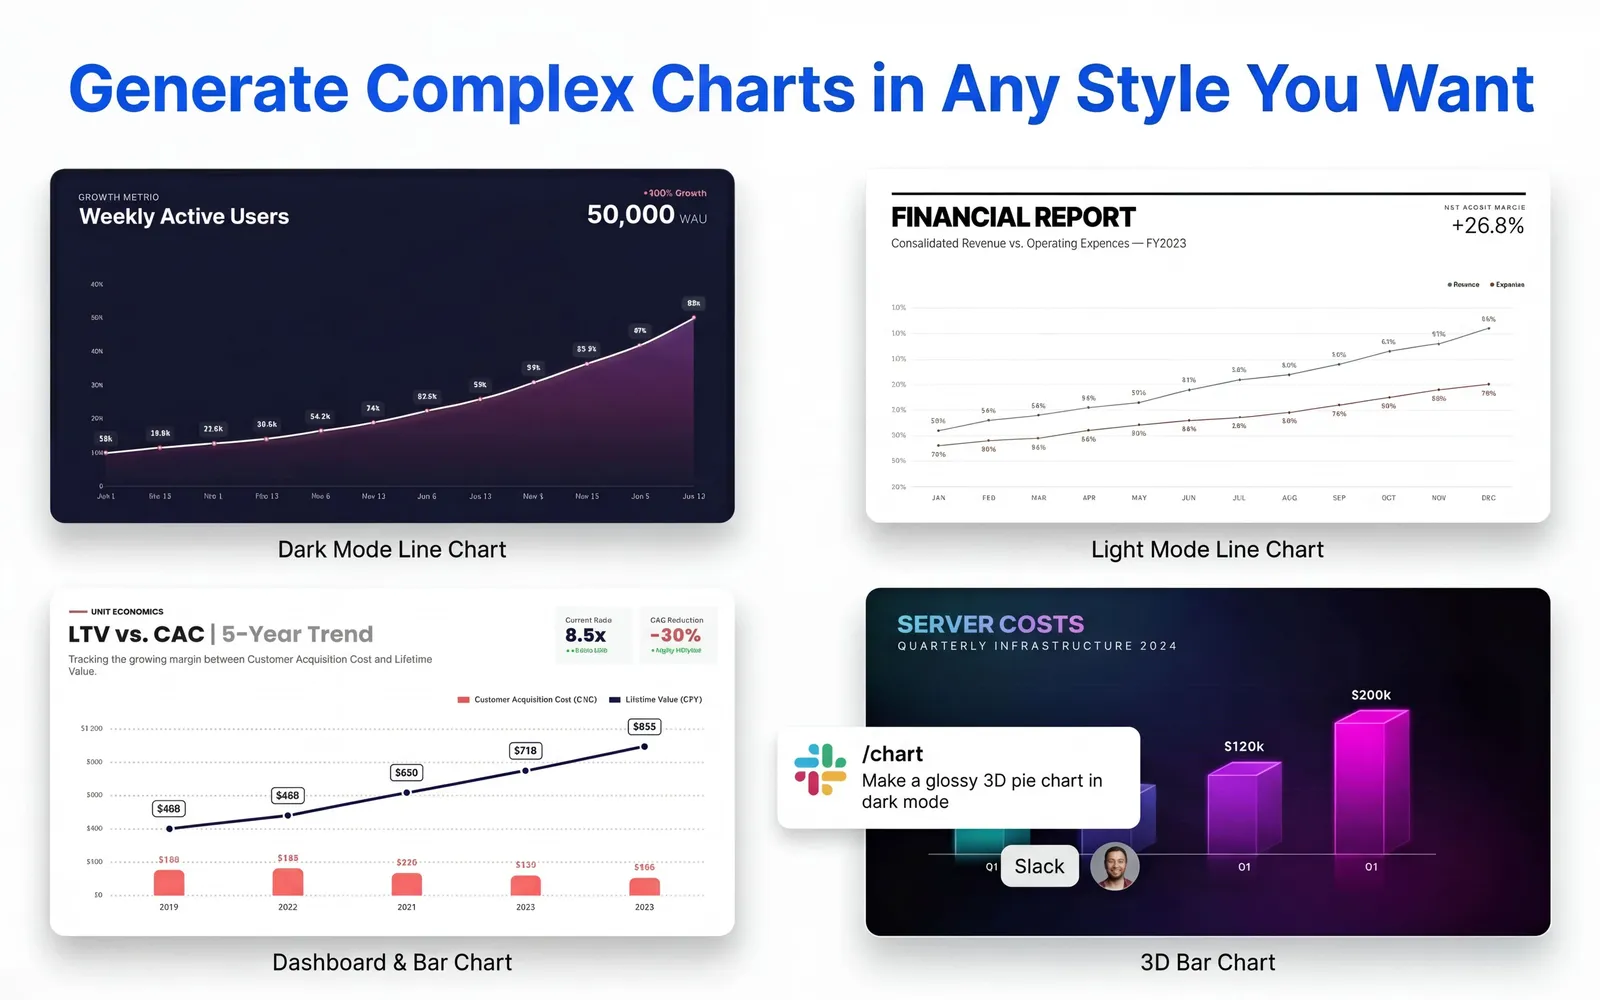
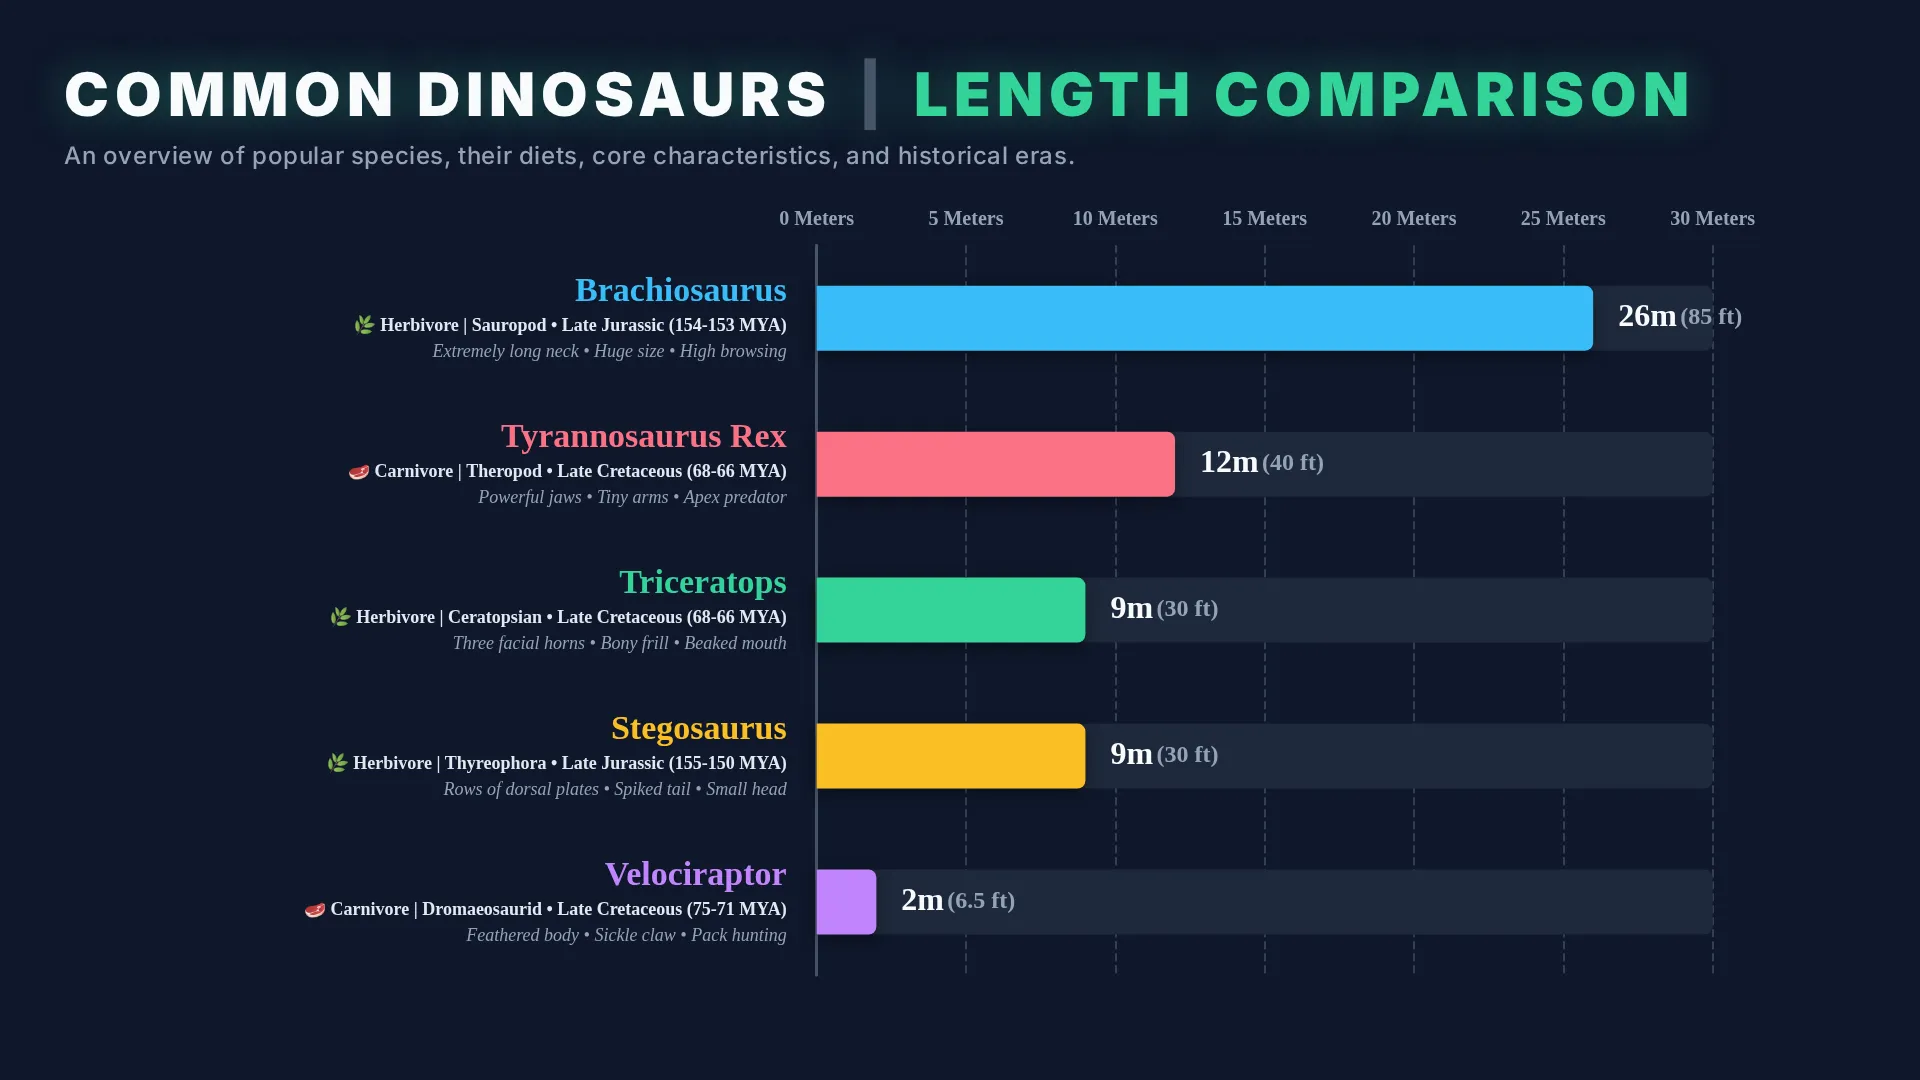
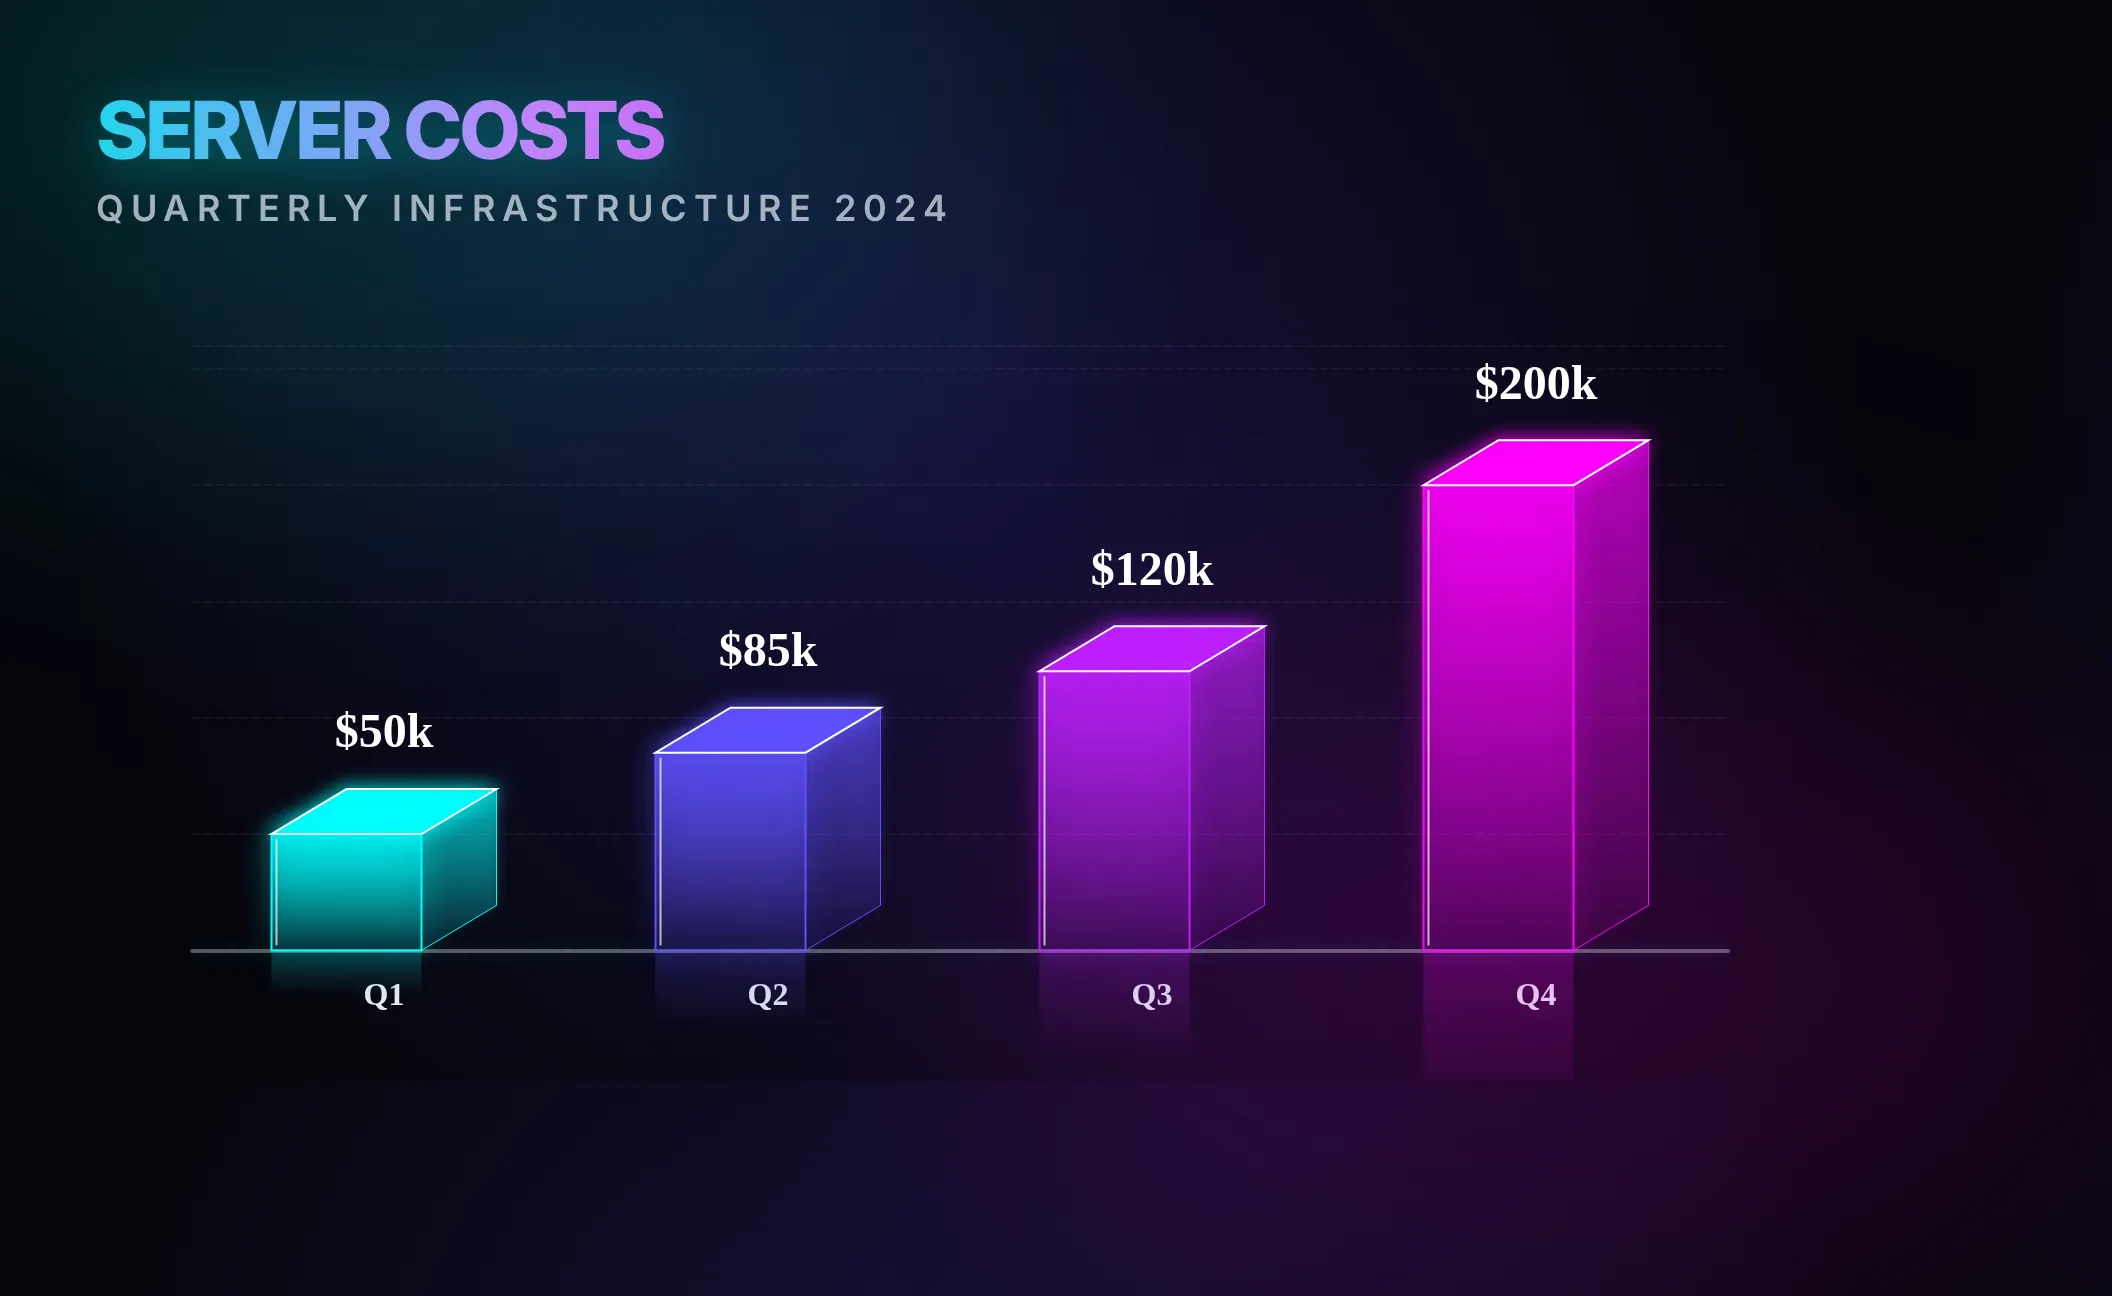
Turn text and data into
beautiful charts
without leaving Slack

Tired of switching to Excel, Google Sheets, or Canva just to share a graph? Charts AI lets your whole team instantly generate professional charts using simple text descriptions — in seconds.

Add to Slack No per-seat pricing — one plan for your whole workspace.

See it in action

From a whiteboard sketch to a PDF report — just describe what you need and Charts AI handles the rest.

Turn sketches into charts Generate charts from PDFs Charts AI features Charts AI features Charts AI features Charts AI features Charts AI features

Why use Charts AI?

Everything your team needs to visualize data — without ever leaving Slack.

๐Ÿง 

Zero Learning Curve

If you can explain it, you can graph it. No messy spreadsheets or clunky UI — just describe your chart in plain English.

๐Ÿ“Š

Endless Chart Types & Styles

Bar charts, pie charts, line graphs, scatter plots, and more. Ask for 3D, minimalistic, corporate blue, modern SaaS, or dark mode styles.

๐Ÿช„

Multimodal Magic

Attach audio notes, PDF reports, whiteboard photos, or up to 10 images at once. Charts AI reads and visualizes them all.

๐ŸŽ™๏ธ

Voice Memos

Send a voice memo explaining the numbers and Charts AI will turn it into a beautiful, presentation-ready chart automatically.

๐Ÿ“„

PDF & Document Support

Drop a financial PDF or data report and tell the bot what chart to extract. Works with annual reports, spreadsheets, and more.

๐Ÿ’ณ

Simple Workspace Billing

Pay once for the whole workspace — no per-seat pricing. Choose a cost-effective subscription or pay-as-you-go tokens.

Example output

Beautiful, presentation-ready charts delivered directly to your Slack workspace. Click to zoom.

Chart example: bar chart Chart example: line chart Chart example: pie chart Chart example: scatter plot Chart example: dashboard Chart example: area chart

How it works

Charts AI fits naturally into your team's existing Slack workflow. Three ways to use it:

1
๐Ÿ’ฌ

Direct Messages

Open a DM with Charts AI and send your data or description directly. The simplest way to get started.

"Create a bar chart: Q1 sales US 120k, EU 95k, APAC 80k"
2
๐Ÿงต

@mention in Channels

Mention @ChartsAI from any channel. The chart is delivered in a thread so your channel stays clean.

"@ChartsAI pie chart of traffic sources: Organic 45%, Paid 25%..."
3
โšก

Slash Command /chart

Use /chart for a private preview only you can see. Click "Share to Channel" when you're ready.

"/chart line graph of weekly revenue, dark mode"

Example Prompts

Just type naturally — Charts AI understands plain English.

Bar Chart

"Create a clean bar chart comparing Q1 revenue by region: US 120k, EU 95k, APAC 80k, corporate blue style."

Donut Chart

"Generate a donut chart of traffic sources: Organic 45%, Paid 25%, Social 20%, Email 10%, modern SaaS design."

From an Image

"Turn this picture of my whiteboard into a 3D line chart."

Available Commands

/chart

Generate a chart instantly

Type your description or attach files. Preview privately, then share when ready.

/billing

Manage your workspace subscription

View your plan, switch tiers, and check remaining generation tokens.

/settings

Adjust preferences

Configure your team's image and generation preferences.

/support

Contact our team

Reach us directly from Slack if you need a hand.

Ready to start visualizing?

Add Charts AI to your Slack workspace and generate your first chart in under 30 seconds.

Add to Slack
Disclaimer: This app uses generative AI (LLMs) to analyze data and produce charts. Please be aware of the potential for inaccurate responses or visualizations. We recommend verifying important results.